Mortality Risk Calculator for Liver Transplantation: OPOM
An accurate and interpretable tool to rank liver transplant candidates

Discrepancy between supply and demand requires an efficient framework
Given this scarcity, it is crucial to design a framework that accounts for the likelihood of death of a candidate, so that the limited supply of donated livers is allocated to maximize the benefit from transplantation.
Since 2002, the Model for End-Stage Liver Disease (MELD) score has been used to rank the priority for liver transplantation. This score is computed from a linear regression that leverages limited information about a patient. The score is then used to estimate the 3-month waitlist mortality risk that determines priority for liver allocation.
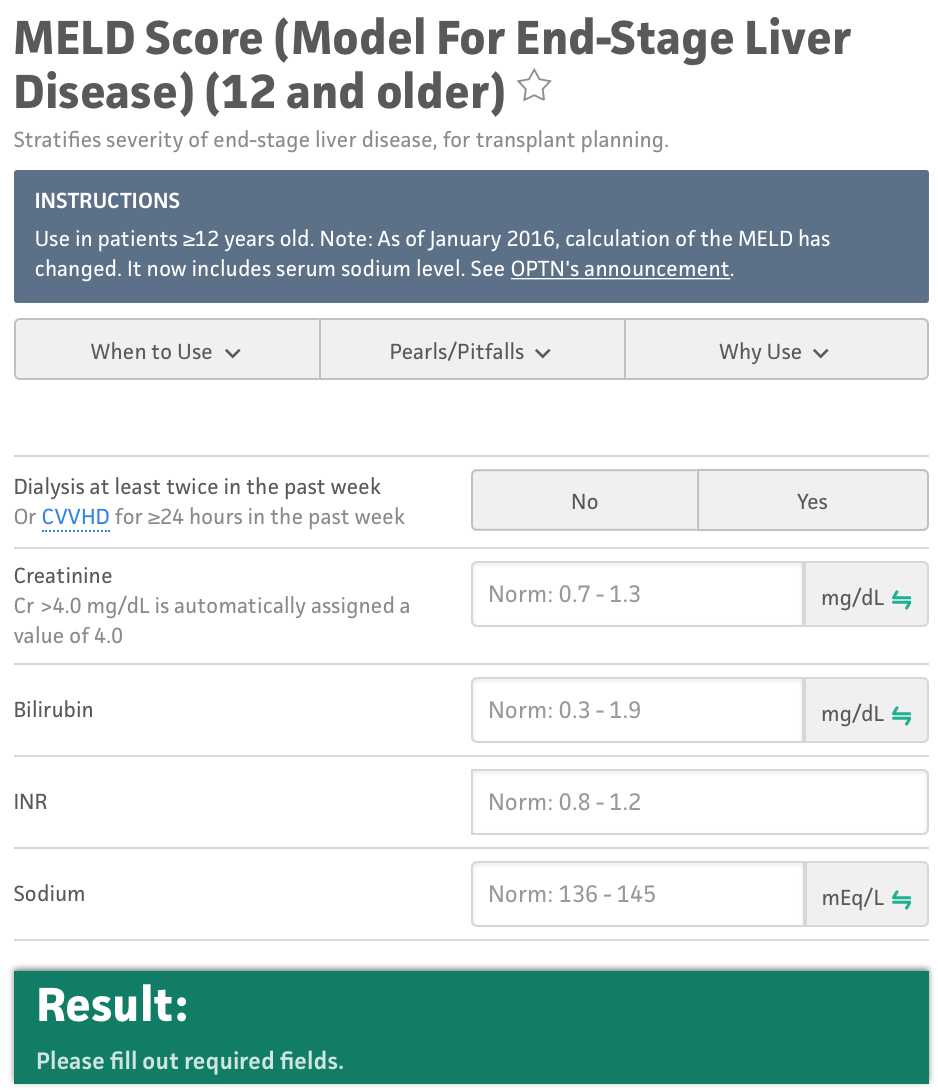
MELD Score Calculator based on linear regression
Risk of mortality is not linear
To improve, we developed an optimized prediction of mortality (OPOM) to estimate directly the risk of a patient dying or becoming unsuitable for transplant within 3 months.
The non linearity of decision trees permits discovery of more complex interactions between the features, and thus can better estimate the risk of mortality. The figure shows the first two splits of OPOM, and we see that the tree starts from the MELD score as a baseline and then builds upon it to provide better predictions.
First two splits of the Optimal Decision Tree predicting 3-Month Mortality.
Accurate risk estimation saves lives
The logic of OPOM is easy to follow and fully interpretable, which makes it extremely useful in this setting. The calculator requires information regarding the characteristics of a patient and outputs the 3-month waitlist mortality risk. The interface on the right recreates the OPOM app which can be downloaded from the link below.
Media coverage

New Model Could Decrease Death Among Wait-listed Liver Transplant Candidates
IAI Partner Dimitris Bertsimas speaking about OPOM in Chief Healthcare Executive

MIT Sloan professors' model decreases liver transplant candidates' deaths by 20%
IAI Partner Dimitris Bertsimas speaking about OPOM in BioSpace
Validation Of The Optimized Prediction Of Mortality (Opom) Machine Learning Model For Non-hepatocellular Carcinoma Candidates Awaiting Liver Transplant
Third Party Validation of OPOM on external cohort
Unique Advantage
Why is the Interpretable AI solution unique?
-
Ability to capture clinically-relevant interactions between variables
The superior modeling power of Optimal Trees allows capturing non-linear effects without sacrificing interpretability
-
Simplicity and interpretability of calculator
A simple user interface is backed up by transparent evidence that doctors can trust and use with ease